

10 minutes
If your business runs across more than one channel, your financial model is probably more out of date than you think. Blended revenue lines, manual actuals, scenario tabs that overwrite each other. It adds up. This guide breaks down the best financial modeling tools available today and what to look for before you make a switch.
TLDR:
A real financial model links all three statements (income, balance sheet, and cash flow) so one change flows through all of them automatically
94% of business spreadsheets contain critical errors; the signal to move on is a model that takes more than a day to update after month close
Omnichannel brands forecasting cash on blended margin are forecasting wrong: model each channel's cash cycle and CM3 separately
AI financial modeling tools fail when they run on raw exports; structured, pre-categorized data has to come first or the output is noise
Iris Finance builds a three-statement model in 1 to 2 hours and rolls actuals forward after each month close in roughly 15 seconds, connected to QBO, Xero, or NetSuite
What Are Financial Modeling Tools?
Financial modeling tools are the software, frameworks, and systems finance teams use to build quantitative representations of a business's financial performance, usually to forecast, plan, and test decisions before committing real money to them.
The category is wide. At one end, you have Excel, which most founders still use and which remains genuinely powerful for building three-statement models, scenario analyses, and cash flow projections from scratch. At the other end, you have dedicated FP&A software, AI-assisted planning tools, and integrated data warehouses that pull live data from your accounting system, sales channels, and ad platforms to keep your model current without manual updates.
In between, there are specialized tools built for specific use cases: cohort-based LTV modeling, rolling forecasts, budgeting and variance tracking, investor-ready scenario planning.
What you are really assessing, regardless of where a tool sits in that range, is whether it gives you a financial picture you can act on, fast enough to matter.
Why Financial Modeling Matters for Founders and CFOs
A financial model is how you test a decision before it costs you. Raise a price, add a channel, take on inventory debt. Without a model, you're guessing.
For founders, the stakes are higher than people admit. Working capital requirements for DTC brands are front-loaded: inventory must be purchased 60 to 90 days before revenue lands, creating a structural cash gap that grows with revenue. Miss that in your planning and you're scrambling for credit at the worst moment.
For CFOs, the problem is timing. Books close two weeks after the month ends. Decisions can't wait that long. The gap between your last confirmed numbers and today is where bad calls get made.
A model connected to live data closes that gap and is what investors, lenders, and acquirers want to see before they commit.
The Core Components of a Financial Model
A three-statement model links your income statement, balance sheet, and cash flow statement so that a change in one flows through the others automatically. That connection is what separates a real financial model from a revenue forecast dressed up in a spreadsheet.
The three statements each answer a different question:
Income statement: Are you profitable on an accrual basis?
Cash flow statement: Do you actually have money in the bank?
Balance sheet: What do you own, what do you owe, and what's left for equity?
Lenders and investors want all three because profit and cash are not the same thing. A brand can show positive net income while burning cash on inventory.
Layered on top are assumptions, which drive the whole model, and scenarios, which let you stress-test them. Change your CAC assumption and watch what happens to contribution margin, cash, and runway simultaneously.
Contribution margin deserves its own mention. Gross margin tells you what's left after product costs. Contribution margin tells you what's left after you paid to acquire the customer and fulfill the order. For any consumer brand selling across multiple channels, that number tracked by channel is what actually tells you where to put the next dollar.
Types of Financial Modeling Tools
The category that fits you depends less on company size and more on data complexity. A $50M brand selling across Shopify, Amazon, and TikTok with a subscription component has fundamentally different modeling needs (including CPG unit economics) than a $50M SaaS business with one revenue line.
Category | What it is | Best fit |
|---|---|---|
Spreadsheets (Excel, Google Sheets) | Manual model-building from scratch | Early-stage, finance-savvy founders |
FP&A overlays | Tools that add structure on top of Excel without replacing it | Teams who want guardrails but aren't ready to leave spreadsheets |
Cloud FP&A software | Dedicated planning tools with accounting integrations and collaboration features | Mid-market finance teams running structured budgeting cycles |
Enterprise planning suites | Full EPM systems with governance, consolidation, and audit trails | Large orgs with dedicated FP&A headcount |
AI-native financial intelligence | Live data warehouses with built-in modeling, forecasting, and AI analysis | Consumer brands that need real-time margin visibility across channels |
Key Features to Look For in Financial Modeling Software
Before requesting a demo, run any tool through this checklist:
Real-time data integration: Does it pull live from your ERP, sales channels, and ad platforms, or does it depend on CSV exports?
ERP connectivity: Confirm it supports your specific accounting system. QBO, Xero, and NetSuite behave differently, and "we integrate with NetSuite" can mean many things.
Scenario modeling depth: Can you run bull/base/bear simultaneously without overwriting your base case? Sandbox logic matters.
Plan vs. actual tracking: Does it flag daily pacing automatically, or do you build that manually each month?
Collaboration and permissions: Can you share a specific dashboard with your agency or investors without exposing everything else?
Auditability: Every number should trace back to an order-level source. If you can't audit a figure, you can't defend it to a lender.
Reporting distribution: Automated Slack or email reports separate tools your team actually uses from ones that collect dust.
The features that get demoed hardest are rarely the ones that matter most after month three. Auditability and ERP connectivity are unglamorous, but they're where most tools quietly fail.
Financial Modeling Tools for Small Businesses and Startups
At the $1M to $10M stage, Excel and Google Sheets are genuinely sufficient for most modeling needs. Build a three-statement model, track monthly actuals against plan, run a few scenarios. That works until it doesn't.
The breaking point is usually channel complexity. Add Amazon to Shopify, layer in TikTok, spin up a subscription program, and suddenly your spreadsheet needs a part-time maintainer just to stay current. Free tools have no live data connections, so every update is manual. Lightweight FP&A overlays help with structure but still depend on CSV exports from your accounting system.
For bootstrapped or early-stage brands, that tradeoff is often fine. But if your fractional CFO is spending most of their time on data cleanup instead of strategy, the spreadsheet has become a liability.
Financial Modeling in Excel: Strengths, Limitations, and When to Move On
Excel is the default for a reason. It gives you total control over structure, formula logic, and layout. You can build a three-statement model exactly how you want it, with no vendor telling you how to organize your chart of accounts. For a single-channel brand with a clean accounting setup, it works well enough that switching tools is hard to make a case for.
The documented problem is errors. A 2024 study found that 94% of business spreadsheets contain critical errors affecting decision-making and financial forecasts. That number is uncomfortable when your model is driving a fundraise or an inventory buy.
The practical failure modes show up before the errors do:
Version control breaks when multiple people edit the same file
Actuals require a manual export from your accounting system every month
A formula change in one tab breaks something three tabs away, silently
Scenario modeling means duplicating the entire file
The signal to move on is usually one of two things: your model takes more than a day to update after month close, or you've caught a material error after a decision was already made. At that point, the flexibility Excel gives you is costing more than it's saving.
Best Practices for Building a Three-Statement Financial Model
Structure your income statement in contribution margin tiers, beyond revenue minus COGS. As a framework for DTC brands, CM1 is gross margin after COGS, CM2 is after fulfillment and shipping, and CM3 is after CAC. Profitable DTC brands target CM3 above 20%. If your model stops at gross margin, you're missing the number that actually tells you whether a channel is fundable.
A few rules that apply regardless of which tool you build in:
Model inventory timing explicitly. Inventory must be purchased 60 to 90 days before revenue lands, and that gap grows with revenue. It must show up in your 13-week cash flow model, not get absorbed into a rounding assumption.
Lock your base case before building scenarios. If changing one assumption overwrites your baseline, you've lost your reference point. Duplicate the file or use sandbox logic.
Stress-test at least three variables at once: CAC inflation, conversion rate degradation, and gross margin compression from discounting. Single-variable scenarios give false confidence.
Tie the balance sheet to working capital explicitly. Accounts payable, inventory on hand, and accounts receivable should move when your business assumptions change.
Build the cash flow statement from operations, investing, and financing activities from day one, connected to the income statement and balance sheet. A lender or investor will go straight to it.
Forecasting Inventory and Working Capital for Omnichannel Brands
Working capital cycles are not uniform across channels, and modeling them as if they are is where omnichannel brands get into cash trouble. A shorter cash conversion cycle frees capital for reinvestment, but only if you're measuring each channel's cycle separately.
A shorter cash conversion cycle frees capital for reinvestment, but only if you're measuring each channel's cycle separately.
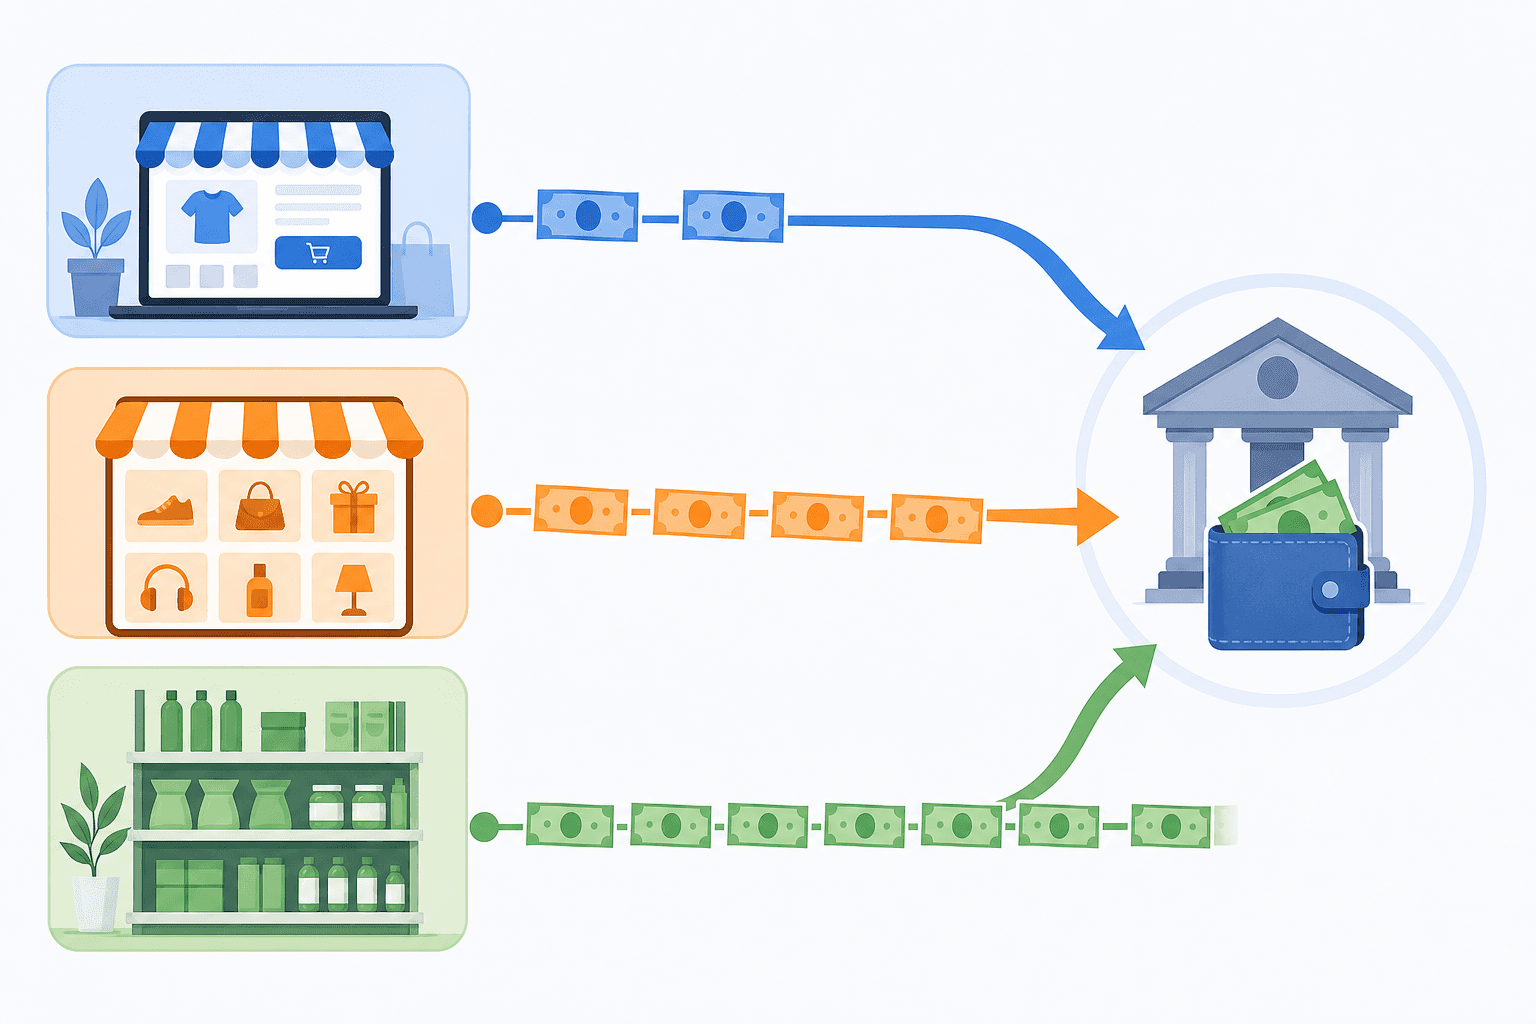
DTC is relatively forgiving: ship fast, collect payment within days. Amazon 3P settles every two weeks, with reserve holdbacks. Retail and wholesale can sit at net-60 or net-90, meaning you've manufactured, shipped, and invoiced before a dollar hits your account. Each channel carries a different cash conversion cycle (most DTC brands run between 60 and 120 days, per Wayflyer's ecommerce CCC benchmarks), and if your model treats them as one blended revenue line, you're forecasting cash wrong.
Inventory reorder points need to be modeled against your channel-specific cash cycle, never against velocity alone. A SKU selling primarily through retail wholesale requires you to carry inventory for months before settlement. That has to appear in your cash flow statement as a working capital outflow, timed correctly.
If Amazon CM3 is 12% and your DTC CM3 is 28%, consolidating them into one blended margin hides what sets the most profitable brands apart: where your cash is actually being consumed. Model each channel separately first. The consolidated view only means something once each channel's margin and cash cycle are correctly represented underneath it.
How AI Is Changing Financial Modeling Tools
Most AI financial modeling tools fail quietly. You paste your data into a general-purpose LLM, ask it to analyze margin trends, and get a confident answer built on mislabeled transactions and inconsistent categorization. The output sounds right. The numbers aren't.
The distinction that actually matters is whether the AI operates on structured, pre-categorized financial data or raw exports. Structure first, AI second. Without that order, you're getting pattern matching on noise.
What AI can do reliably when the data is clean: generate variance analysis in seconds, surface ranked drivers behind a margin shift, auto-populate scenarios from historical brand data, and support capital performance modeling and build dashboards from a text prompt or screenshot. What it still can't do: replace judgment on one-time events, unpredictable expenses, or decisions that require business context no model has seen.
Iris structures data through every transformation layer before Finn, our AI copilot, touches it. The framing internally is "bumper rails, not a free-for-all." Ask Finn why contribution margin dropped 7% and you get a ranked variance breakdown, not a hallucinated explanation.
How to Automate Variance Analysis Without a Dedicated Finance Analyst
Variance analysis is comparing what you planned against what actually happened, then explaining why the gap exists. Done well, it tells you whether a margin miss came from CAC inflation, a conversion rate drop, or a COGS increase. Done poorly, it tells you nothing useful three weeks after the month closed.
The manual version is why finance teams burn time: pull actuals, export the budget, match everything in a spreadsheet, hunt for drivers, write commentary. By the time that's done, the insight is stale.
Automated variance tracking changes the sequence. A tool connected to live accounting data and your sales channels can flag deviations daily, rank the drivers automatically, and surface the "why" without anyone running a pivot table. You set thresholds and the tool tells you.
A practical workflow for a lean team:
Set plan targets once, at the start of each period
Let the tool flag daily pacing: on pace, watch, or off pace by metric
Review a ranked driver summary weekly instead of rebuilding the analysis each time
Use monthly variance commentary that's pre-populated from the data, then edited for context
Iris flags every metric against plan daily and generates variance analysis on demand. Ask Finn why net income missed plan and it returns a ranked breakdown by driver in under 90 seconds. That's the difference between variance analysis as a deliverable and variance analysis as a decision input.
How to Choose the Right Financial Modeling Tool
Start with your accounting system and work outward. If a tool claims it integrates with your ERP, verify exactly what that means before committing. "Supports NetSuite" can mean a full bidirectional sync or a manual CSV import dressed up in marketing language.
A quick decision framework:
Modeling style: Driver-based models, where you set CAC, conversion rate, and AOV as inputs and let the model calculate revenue, are more useful for planning than account-based models that mirror your chart of accounts. If you're forecasting growth, you want drivers.
Integration scope: List every system you use, from accounting to sales channels to ad platforms. Run that list against the tool's actual integration documentation, not the sales deck.
Scenario depth: Can you run multiple scenarios simultaneously without overwriting your base case? If editing one scenario destroys another, the tool creates more work than it saves.
Consolidation needs: Multiple entities or channels? Confirm the tool handles that natively. Many don't.
Permissions: If you're sharing with investors, agencies, or a board, you need granular access controls.
Time-to-first-forecast: Ask directly. Some tools take weeks of configuration before you see a single output.
The most common mistake is optimizing for features you'll use in month six instead of the ones you need in week one.
Iris Finance: Financial Modeling Built for Consumer Brands
Iris sits at the intersection of everything this guide has covered: live data integration, three-statement modeling, scenario depth, and AI that operates on clean structured data instead of raw exports.
The financial model builds in 1 to 2 hours using your own chart of accounts from QBO, Xero, or NetSuite. Actuals roll forward after each month close and the reforecast takes roughly 15 seconds. For brands preparing to raise, extend a credit line, or size an inventory buy, that speed is the difference between a model you trust and one you're still updating when the conversation starts.
Plan vs. actual tracking runs daily. Every metric is flagged as on pace, watch, or off pace against your targets. Contribution margin by channel, CAC payback, MER, LTV:CAC, all updated from live data.
Scenario modeling is calibrated against anonymized data from approximately 500 brands and roughly $20B in GMV. The ranges it surfaces reflect what similar omnichannel CPG brands have actually achieved. The sandbox approach keeps your base case locked while you test tariff scenarios, channel expansion, or pricing changes side by side.
Finn, our AI copilot, delivers contextual variance analysis in under 90 seconds. Ask why contribution margin dropped 7% and it returns a ranked driver breakdown, built on pre-labeled, structured data at every transformation layer. Iris reached seven-figure ARR in its first year and holds a 97% retention rate. That's what happens when AI-powered FP&A software keeps the financial model current without anyone manually maintaining it.
Final Thoughts on Financial Modeling Tools for Consumer Brands
A good financial model doesn't need to be complex. It needs to be connected, current, and built around the metrics that actually drive your decisions. Contribution margin by channel, working capital timing, and scenario depth matter far more than a feature list. If you want to see what that setup looks like for your business, get in touch with the Iris team.
FAQ
What are best practices for building a three-statement financial model for a fast-growing DTC brand?
Structure your income statement in contribution margin tiers (CM1 after COGS, CM2 after fulfillment, CM3 after CAC) and use those tiers to judge whether a channel is fundable. Model inventory timing explicitly in your cash flow statement, lock your base case before building scenarios, and stress-test at least three variables simultaneously: CAC inflation, conversion rate degradation, and gross margin compression. A lender or investor will go straight to your cash flow statement, so build it connected to the income statement and balance sheet from day one, not as an afterthought.
What are best practices for forecasting inventory and working capital for an omnichannel CPG brand in 2026?
Model each channel's cash conversion cycle separately. DTC collects in days, Amazon 3P settles every two weeks, and retail wholesale can run net-60 to net-90, meaning you've shipped and invoiced long before a dollar arrives. Blending those timelines into one revenue line produces a cash forecast that's wrong in ways you won't catch until you're short. Map reorder points against channel-specific cash cycles, never against velocity alone, and let inventory purchases show up as timed working capital outflows in your cash flow statement.
How do I automate variance analysis for a CPG brand without hiring a dedicated finance analyst?
Use a tool connected to live accounting data and your sales channels so deviations flag automatically against your plan. Iris Finance runs this automatically: ask Fin why contribution margin dropped 7% and you get a ranked variance breakdown in under 90 seconds, built on pre-labeled structured data, not a pivot table someone assembled after the month closed.
Iris Finance vs Excel for financial modeling: which is better for a consumer brand scaling across Shopify, Amazon, and TikTok?
Excel gives you control and works well for a single-channel brand with a clean accounting setup. The problem is that actuals require a manual export every month, version control breaks under collaboration, and a formula change in one tab can silently break three others. For a brand operating across Shopify, Amazon, and TikTok with a subscription component, the spreadsheet becomes a part-time maintenance job. Iris Finance builds an investment-banking-grade three-statement model in one to two hours from your own chart of accounts, rolls actuals forward after each close in roughly 15 seconds, and keeps contribution margin by channel updated from live data without anyone manually maintaining it.
What financial modeling tools are worth using for a CPG brand preparing to raise funding or extend a credit line?
Investors and lenders want a three-statement model with a clean audit trail (every number traceable to an order-level source), plus scenario analysis that reflects realistic ranges, not arbitrary assumptions. The best financial modeling tools for this use case connect directly to your ERP and sales channels, support sandbox scenario logic so your base case stays locked while you model alternatives, and let you generate investor-ready outputs without rebuilding the model from a CSV export. Iris Finance's scenario modeling is calibrated against real brand data, meaning the ranges reflect actuals from comparable consumer brands, not arbitrary assumptions.
Related posts
Actionable data, proven strategies, and clear forecasts, empowering you to make smarter decisions and scale with confidence.